Gabe Wrapped 2025
12 min read · 2,365 words
For the past year I've tracked everything about my day, from what I eat to where I went to how I felt.
I was interested in seeing if any behaviors correlate at all. My approach was to track everything and at the end of the year see what patterns emerged.
This is that data.
A trend you will see is around August (week 31), nearly every statistic takes a downward turn. This is when I moved out of Orlando back to my parent's house. Most of my social life exists in Toronto and Orlando, not in Wellington. So yeah, keep that in mind.
By default, graphs are scaled to highlight differences in values. You can click the "Scale" button on the bottom to toggle between the scaled and unscaled versions of graphs.
Note: emotions are scaled on an arbitrary scale, with 0 being the least, 5 being moderate, 10 being the strongest
Drinking
Let's begin strong, on a weekly basis how many drinks did I drink? I measured this in standard drinks, so a glass of wine, a bottle of beer, or a shot of liquor all count as one standard drink. As expected, moving back home caused a massive drop in drinks per week, with the two spikes in October coinciding with when I went back up to Orlando for parties.
Huge spikes the weeks of Jan 8 and March 19. Those weeks are when I went to New York and Chicago with Marce and Nick. The three of us very much enjoy our bars. (And can handle our alcohol)
Showing it on a per-day of the week basis is honestly, again, to be expected. Friday and Saturday are big drinking days. Jazz Night at Austin's Coffee took place on Thursday night, so I would usually have a drink or two there then head over to Spatz for a pint or two. I am honestly shocked Tuesday isn't higher, as I used to host weekly group dinners on Tuesdays.
Correlation: 0.375 (193 days)
Plotting the number of drinks I had on any given day against my happiness shows an interesting trend: the more I drink, the happier I am. Not going to read into that.
While I was writing this and getting the data points I wanted, I threw the dataset to Claude Opus 4.5 and said "have at it!" This is one of the things it found, that the day after heavy drinking I am happier than on days with light or no drinking. I don't know what to make of this honestly, other than maybe a lingering social effect.
Liam also pointed out how it looked like I slowed down drinking towards the end of every month. I ran the numbers on it, and turns out I actually sped up towards the end of the month.
I did some analysis on this, and it tends to correlate to when I went to Marce, Nick, and Bem's house. Again, me, Marce and Nick are heavyweights, so this checks out. I'm curious about the underlying reasons I visited their house more at the beginning and end of months rather than in the middle.
Caffeine
I'm known as "the tea guy" to some. I own 50+ different types of tea and always offered it to people I had over. But how much of a "tea guy" was I really?
As it turns out, not much. Spoiler alert: guy who works like a dog drinks a lot of coffee. Hitting 15 cups per week isn't the least bit shocking to me. Honestly, I'm shocked that the amount of coffee I drank is that low.
Here we get to see my top cafés! Finally, the Gabe secret sauce revealed...
Truth be told, even though Paneterie is my #1 visited café, I've never actually had coffee there. It was right by where I worked and I knew the owner was French, so I only stopped in for their pain au chocolats.
But Composition Coffee being my number one in South Florida I actually drink at and Croissant Gourmet being my number one in Orlando are accurate. They are by far my two favorite cafés in those locations.
Just for fun, a cumulative chart of all the beverages I've drunk over the year.
Funny story: I was in a Discord call with my Canadian friend group when I was calculating this data. My reputation for drinking is well known, so I decided to ask them how many standard drinks they thought I had drunk in 2025. Nikola says "400", and Liam chimes in with "684". I was flabbergasted and speechless for a sec before asking if I had posted the number already in chat. Apparently I hadn't. Liam just managed to randomly guess the exact number. Luckily, he also clipped that moment.
Social Activity
In 2025, I visited 522 unique places a total of 1213 times.
Places visited is a decent indicator of social activity. When I originally did this Excel spreadsheet a few years ago, I tracked everyone I had talked to in any given day. Understandably, it got hard to track.
You can see the three (major) vacations I took this year, New York/Chicago in Jan, New York again in April, and Canada in June.
Honestly some really shocking data here. Turns out not only did I visit my friends' houses a LOT less than I thought I had, I visited my Canadian friends' houses MORE than most of my Orlando friends. I spent over half my year in Orlando, and only about 2% of my year in Canada. Not sure what to make of that.
The only name I don't recognize on this list is "Sam". Genuinely no fucking clue who that could be.
Again, I visited bars a LOT less than I thought I did. Lots of variation (click Show More at your own risk), but I am honestly astounded. I really went to Moderne THREE times the whole year?
Venue types correlation with happiness. Lowkey a shocker. I would've expected friends' houses to be higher. Sneak appearance from cultural out of nowhere, but that also coincides with me being on vacation.
And to cap off, top places by type. Epic Universe/Commodity both coincide with when I was on the networking team building Epic Universe, but there is occasionally an overlap of days where I would visit both sites.
Dating Life
I am notoriously private about my dating life. I won't be going in to any specific details here, as even temporal data of when I was dating could give away too much, but here are the general stats:
- Spent 23% of the year in talking stages (84/365 days)
- Talking stages with four different women
- Average duration of 4.4 days, with an average gap of 14.1 days between
- Longest continuous stage was 26 days, longest gap was 55 days
The takeaway here is that I tend to have very unstable situationships. Woo me, I guess.
Happiness vs Women Talked To (r = 0.102)
Statistically insignificant correlation between happiness and being in a talking stage, to me this was a shocker. I usually assumed I was happier in talking stages; however in the words of Liam, "I've heard your stories about these women". He may have a point.
Alcohol vs Women Talked To (r = 0.070)
Statistically insignificant correlation between drinks and women as well.
Music
Spotify is inaccurate non-granular for music tracking, so I used Last.fm to track my music. I've been using it for years, and now is finally the time I get to put the data to use.
For top artists, it's honestly not very shocking (to me atleast). Apparently to others, it's a shock that I listen to rap. I don't know why it's a shock. The only real surprise is I have more rap than rock in my top artists, but given that my rap listening is more concentrated than my rock it kinda checks out.
Kanye going strong for the ninth year in a row as my top artist by a large margin.
Six out of the top ten songs are by julie! Fun fact about them, I've been listening to julie since they had sub-20,000 listeners on Spotify.
I don't know how the fuck Tanukichan got up there. It actually makes zero sense. I'm surprised theres not more Aznavour or System of a Down up there though.
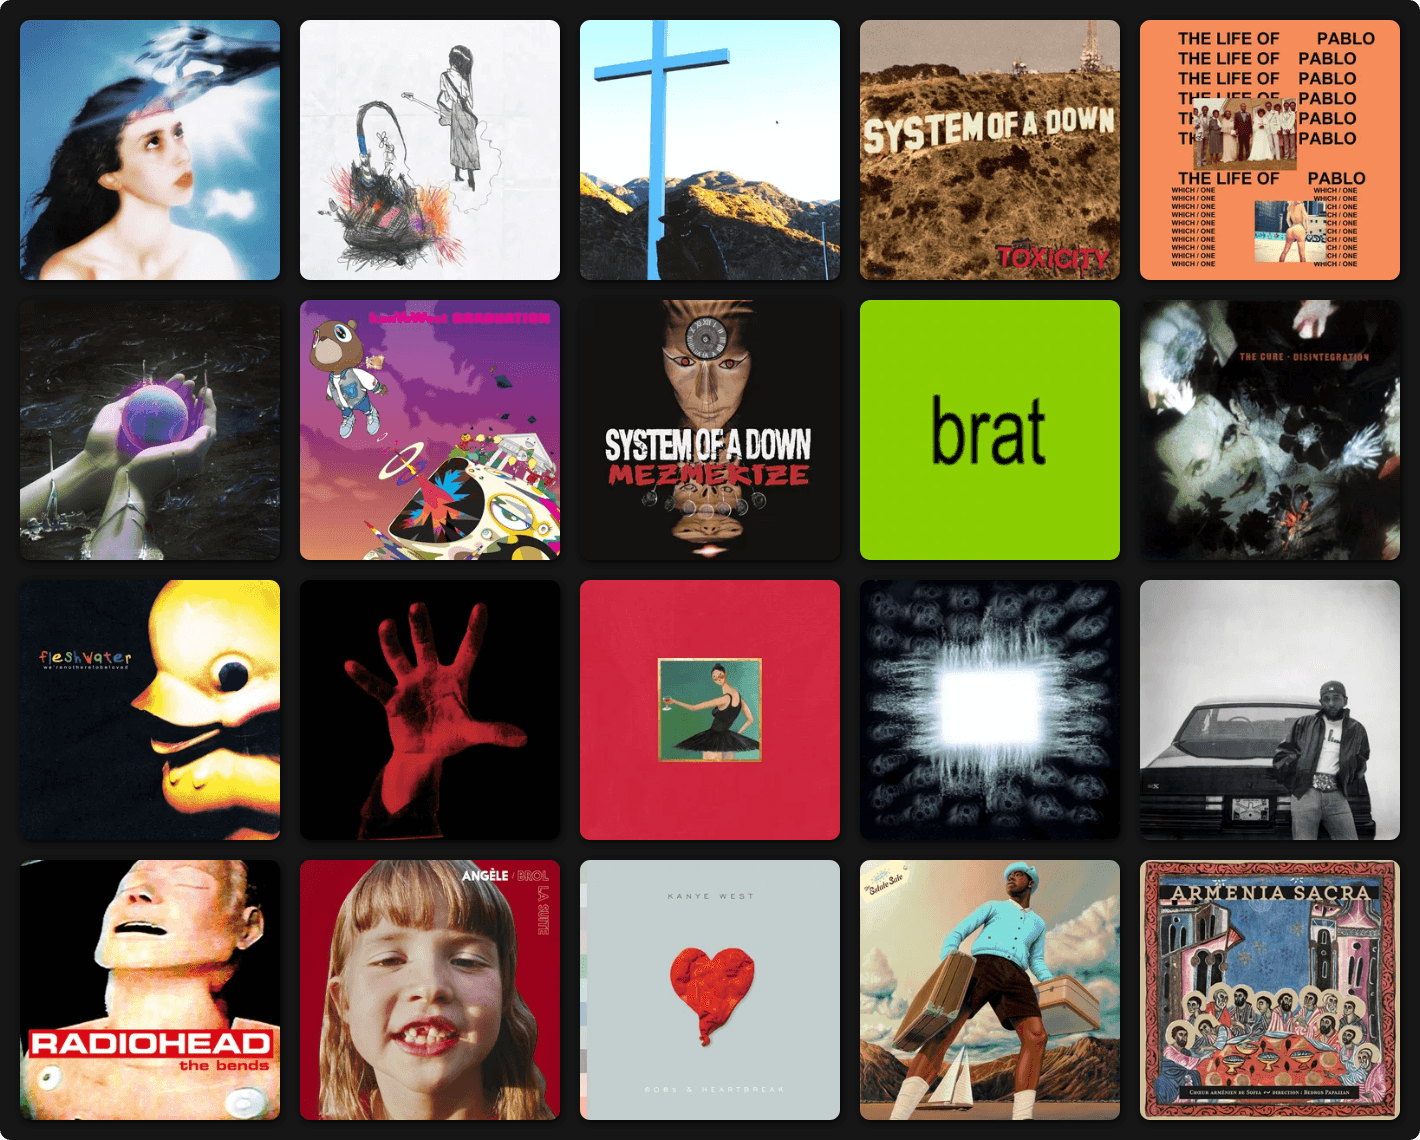
Top albums are, again, not a shocker (to myself atleast). I like the trichotomy of Kanye-Charli-SOAD. I feel it's an accurate descriptor of myself.
Artist listens over time, cumulative. I am shocked that I listened to only a single Kanye song in December. (It was Addiction from Late Registration, looks to have been in a Daylist.)
You can see in September my System of a Down listening skyrocketing, I had just come back from the SOAD concert in Toronto and was elated for weeks afterwards. I don't know what sparked the resurgance of Magdalena Bay and Charli in my listening habits though. I will say, Magdalena Bay hit me like crack.
Album listens over time, cumulative. Again you can see the massive growth of Magdalena Bay and Charli in my listening habits towards the end of the year. In the second month Imaginal Disk shot up to my #1 album by a significant margin.
I like the pattern going on with Graduation, where it looks like I will listen to it one month, then take a break the next, then repeat the cycle. I cannot explain that behavior outside of sheer chance.
Gastronomy
Here are the top foods I ate in 2025.
This is slightly skewed by me moving back to my parents' house, as unfortuntely, my parents cook meals for the family before I get the chance to. If we filter to before I moved back home and my cooking was all my own, we get this:
I don't know if that's better or worse tbh. Definitely more balanced.
Top restaurants are to be expected. (Save for Taco Bell, but that is 5/5 times me driving my friends there after a night out drinking and myself not ordering anything.)
A LOT of restaurants were not revisited. I am honestly shocked at how many one-and-dones I did, given that I typically eat at places I have a good feeling I will enjoy. Looking over the list, there's not many places I didn't enjoy. I guess my horizons are just that broad.
Another insight from Claude. I think the correlation here has more to do with social, as I would only really have Mexican food when out with friends, whereas Armenian food and Asian Noodles tended to be more "I am by myself" foods.
This is another interesting insight from Claude that again, I think more-so correlates to my travel and social life than actual gastronomic habits. I don't cook when I'm travelling. Lunch, dinner, and a bite at a café gets me to three times eaten out in a day. I often would hit that during my travels. So yeah, skeptical of this.
Languages
Duolingo
Mango
Mango is structured in "Lessons" (new material), and "Reviews" (reviewing old material). For simplicity's sake, I combined both of them into one data point here. In the raw data they are two separate points.
Anki
Anki was a bit different, as the only language I had practiced was Armenian. All it took was one day of not practicing to derail the entire endeavor. I know I said in my diary "no resolutions for 2026, resolutions are stupid", but maybe I should make Anki my resolution.
Emotions
These are scaled from 0-100, with 0 being the lowest, 50 being moderate, and 100 being the highest. I scored on a base of 50 for happiness and 0 for every other emotion.
In reality, I scored these from 0 to 10 with increments of 0.5, but the software I built to track these multiplied them by 10 to get rid of decimal points. Technical reasons, computers are shockingly bad with decimals.
Happiest on Friday and Saturday, also the most social those days. Go figure.
Inconsequential.
Least anxious on Fridays and Saturdays, given the boost from social probably. But also look at the grand scale of this thing. Sunday is average of 3.4 out of 100. Inconsequential again.
March was a weird month. Shocked I kept it together as well as I did TBH. As one would figure, moving back home, being away from my social life dropped average happiness.
Happiness again but more granular. Had a few day-long tweak session there.
Really inconsequential stuff here. You can see the grand scale of how little I felt these other negative feelings.
I did find this interesting though. I was significantly happiest on days I gamed (I seldom game anymore), and was notably more happy on days I didn't watch TV than on days I did watch TV. Shocked reading is as low as it is, but also eh not really. I read a lot so it would be closer to my baseline than anything.
Again, not shocked that I am both happier and less exhausted on days I am not programming.
And not even remotely shocked that when I am travelling on vacation, I am happier.
How certain activities correlate to how happy I am. The closer to 1, the more of a positive impact. The closer to -1, the more of a negative impact. The closer to 0, no impact.
This one does kind of concern me, experiencing some level of exhaustion on almost 47% of days.
Other Random Facts
- 62.7% average happiness
- 681 unique foods eaten
- 267 days spent programming
- Read books on 169 days
Takeaways
Honestly, I don't really see much to take away from here. My mood is dependant on my social life, and with increased social activity comes increased alcohol consumption and increased eating out. I think this is definitely interesting data to look at, but for me it is already stuff I knew well.
Really the only shockers to me were some places that I visited more or less often than I'd thought, and that my Jackson Pollock of situationships and failed talking stages had zero effect on my anything.
I am continuing this experiment throughout 2026, so hopefully we will get to see some interesting year-to-year comparisons.